
AI model monitoring and MLOps tools matter most when your model “looks fine” until users complain, costs spike, or a regulator asks what happened. If you are choosing tooling now, you are probably balancing three pressures at once: reliability in production, faster iteration, and enough governance to sleep at night.
The tricky part is that “monitoring” means different things to different teams. Data scientists often want drift and quality signals, platform teams want uptime and telemetry, security and compliance want lineage plus audit trails, and product teams want SLA tracking tied to business metrics. One tool rarely nails every angle.
This guide stays practical: how to map your needs to ml model observability platforms, ml pipeline monitoring software, and governance features, plus what “good” looks like for drift detection, incident response, and automated retraining. You will also get a comparison checklist and a table you can reuse in an internal tool review.
What you are really buying: monitoring vs observability vs governance
People mix these concepts, then end up disappointed with a tool that was never meant to solve their problem. Here is a clearer mental model you can share with stakeholders.
- Monitoring: known metrics and thresholds, like latency, error rate, or accuracy on labeled feedback. Great for “is something wrong right now?”
- Observability: investigation and root-cause workflow, using traces, logs, and rich context about inputs, features, and model versioning. This is where production model telemetry and logging becomes non-negotiable.
- Governance: proving what you did, when, and why, including approvals, lineage, and documentation. This underpins model governance and auditability and supports Responsible AI programs.
According to NIST, AI risk management depends on continuous measurement and documented controls across the system lifecycle, not just a one-time evaluation. That is a strong hint that you need more than a dashboard if your model touches sensitive decisions.
Common tool categories (and where they fit in a real stack)
Most teams land on a stack, not a single product. The categories below often overlap, but the “home base” matters for ownership and operations.
1) ML model observability platforms
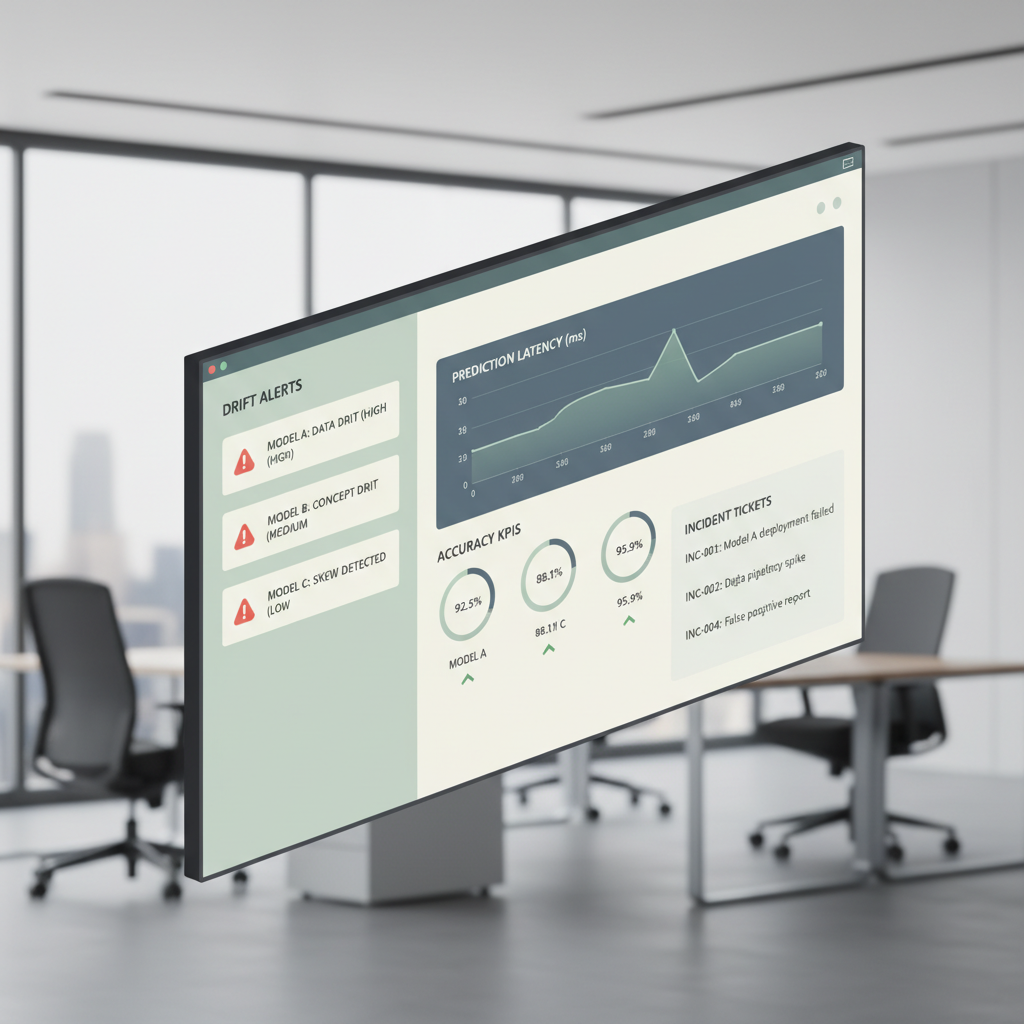
These tools focus on understanding behavior in production: input distributions, feature behavior, output quality signals, and linkages to model versions and deployments. They usually shine at model performance drift detection and triage workflows, especially when labels arrive late or sporadically.
2) ML pipeline monitoring software
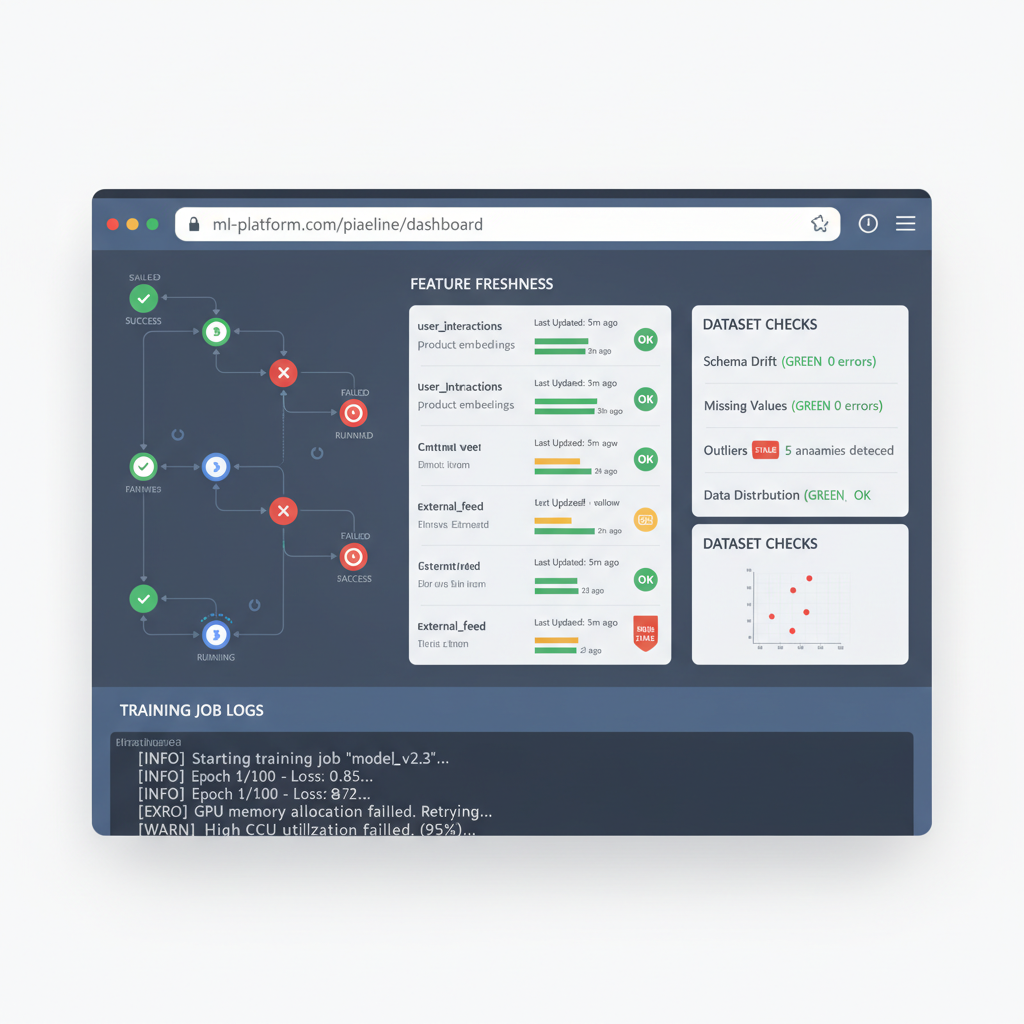
Pipeline monitoring targets training and data workflows: job failures, stale datasets, broken feature pipelines, and orchestration health. If your biggest pain is “the daily training run silently stopped,” this category should be your first stop.
3) Feature stores and feature drift monitoring tools
Feature stores solve reuse and consistency, but many teams discover they also need feature drift monitoring tools to catch upstream changes like new null patterns, shifted ranges, or silent encoding changes. This is especially relevant when multiple services consume the same features.
4) Model registry + experiment tracking
Registries and tracking systems help you answer “what version is live” and “what data and parameters produced it.” They are building blocks for auditability, but they do not automatically give you production behavior insights.
5) Responsible AI monitoring solutions
These typically add fairness, explainability, and policy checks. They matter most when you must demonstrate ongoing oversight, not only pre-launch testing. In practice, they work best when connected to your production telemetry, not sitting in a separate reporting silo.
A practical decision matrix (use this to shortlist tools)
If you want an easy internal evaluation, start by forcing clarity on “what outcome are we protecting.” The table below maps outcomes to capabilities and the teams that usually own them.
| Outcome you care about | Capabilities to prioritize | Signals you should capture | Typical owner |
|---|---|---|---|
| Stable user experience | Latency/error monitoring, ml model SLA tracking, alerts | p95 latency, timeouts, error codes, throughput | Platform/SRE |
| Model quality stays acceptable | model performance drift detection, eval automation | Quality metric trends, delayed labels, feedback rates | ML + Product |
| Inputs remain “what we trained on” | feature drift monitoring tools, data validation | Distribution shift, nulls, schema changes, outliers | Data/ML |
| Faster, safer releases | Canary/shadow deploy support, version traceability | Model version, config, feature set, rollout cohort | MLOps |
| Audit readiness and compliance | model governance and auditability, approvals, lineage | Who approved, training data lineage, policy checks | Risk/Compliance + ML |
| Less firefighting | mlops incident response workflows, runbooks, routing | Alert context, incident history, remediation actions | SRE + ML |
Key takeaway: if your shortlist does not clearly cover at least one “outcome row” end-to-end, you will likely need integrations or a second tool.
Self-check: which monitoring problems do you actually have?
Teams often buy heavy tooling to solve a problem they do not have yet, or ignore a problem they already have because it looks “non-urgent.” This checklist helps you place yourself.
- You need inference reliability monitoring if alerts mainly come from 500s, timeouts, GPU saturation, or sudden cost spikes.
- You need model observability if the system is up, but users report “worse results,” and you cannot explain which segment or input pattern changed.
- You need data/feature monitoring if upstream teams ship schema changes, new categories, or different null handling, and models degrade days later.
- You need governance if you cannot quickly answer: what model was live last Tuesday, what data it used, who approved it, and what tests it passed.
- You need retraining orchestration if “we will retrain weekly” turns into ad-hoc scripts, broken jobs, and unclear rollback paths.
According to Google Cloud Architecture Center, production ML systems require ongoing monitoring for both system health and model behavior, because model performance can change even when infrastructure stays stable. That framing helps in budget conversations.
How to implement AI model monitoring without boiling the ocean
You can get value quickly if you sequence the work. Many successful rollouts follow a “thin slice” approach: one model, one workflow, clear ownership.
Step 1: Start with a minimum telemetry contract
Decide what every prediction event must carry. Keep it small but sufficient for triage.
- Model name + version, deployment environment, timestamp
- Request ID / trace ID for correlation
- Latency, status, and fallback path (if any)
- Hashed user/session identifiers when appropriate (privacy-aware)
- Key feature summaries (not necessarily raw PII), plus feature version
Step 2: Define “drift” in business terms, not only statistics
Drift metrics can be sophisticated, but the operational question is simple: “Do we take action?” Tie thresholds to impact where possible, for example a segment-level drop in conversion proxy or an increase in human review volume. This is where many AI model monitoring and MLOps tools feel confusing, they show dozens of charts but do not tell you which one matters.
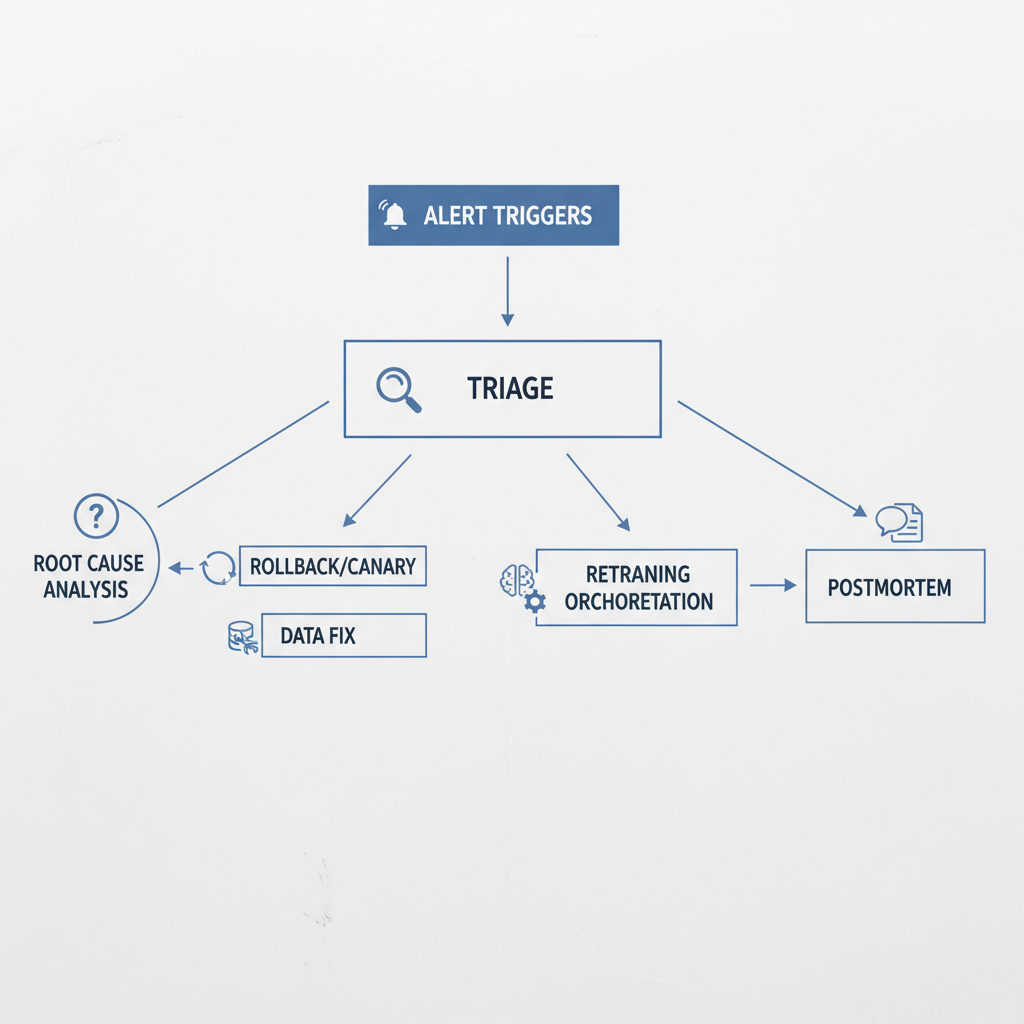
Step 3: Build an incident response path that includes ML
Traditional on-call tends to stop at “service is up.” For ML, you want runbooks that include data and model actions.
- Clear severity definitions for quality regressions, not just outages
- Owner mapping: platform handles uptime, ML handles quality, data handles source issues
- Rollback and safe-mode behavior (fallback model, rules, or human-in-the-loop)
Step 4: Add retraining only after you can detect and verify
Automated model retraining orchestration sounds great, but it can amplify mistakes if your evaluation gates are weak. Gate retraining on data checks, reproducible training, and a promotion process that includes offline and online validation when feasible.
Tool selection tips that usually save time (and regret)
This is the stuff that tends to bite teams after procurement, when the honeymoon ends.
- Ask where labels come from. If labels arrive weeks later, you need proxy metrics and robust delayed-feedback support, not only real-time accuracy charts.
- Look for slice-and-segment debugging. If you cannot break metrics down by cohort, geography, device type, or feature buckets, root-cause work drags on.
- Verify integration depth. “We integrate with your stack” can mean anything from a webhook to full trace correlation with your existing APM.
- Check audit outputs. For model governance and auditability, you want exportable evidence: model cards, lineage graphs, approval logs, and retention policies.
- Confirm privacy and security fit. Data minimization, redaction, and access control are not optional in many US orgs, especially for customer-facing products.
According to OWASP, logging practices should avoid sensitive data exposure and support incident investigation. Translate that into ML terms: log what you need for diagnosis, but be deliberate about PII, prompts, and raw inputs.
Common mistakes (even strong teams make them)
It is rarely a lack of dashboards. It is usually a lack of decisions and ownership.
- Monitoring only infrastructure: uptime looks perfect while predictions quietly degrade.
- One global drift score: it hides segment failures, and you find out when a high-value cohort churns.
- No SLA definition for ML quality: you track latency SLAs but ignore quality SLAs, so product escalations feel subjective.
- Alert fatigue: too many warnings, not enough actionable alerts, on-call starts ignoring them.
- Auto-retraining without guardrails: you ship a worse model faster, now with extra confidence.
If you are implementing AI model monitoring and MLOps tools in a regulated area, be extra cautious about explainability claims and fairness metrics. Many methods are context-dependent, and it is wise to involve legal, compliance, or risk teams where appropriate.
Conclusion: pick tools that match your operating model, not your wishlist
The most useful setup is the one your team will actually run: clear telemetry, drift signals tied to action, and mlops incident response workflows that include both platform and ML owners. Start with one production model, define your SLA and triage path, then expand coverage.
If you want a concrete next move, do these two things this week: write a one-page “prediction event contract” for telemetry, and run a tabletop incident exercise for a quality regression, not an outage. The right tool choices become obvious after that.
Action call: if you are evaluating vendors, ask for a demo that starts from an incident scenario and ends with a postmortem artifact, not a tour of dashboards.